Get Your Sports Career Moving With Hockey Analytics
March 24, 2017
by


 To the uninformed SAT% looks like something that happens when you bump your keyboard - a randomly generated assortment of letters and symbols. But astute hockey minds know better. They know that 4 of the last 7 Stanley Cup winners were in the top 4 in the NHL for SAT%.
What is SAT%? How do you calculate it? How do you get your team to improve their SAT%? How do you draft players and build a roster that will compliment this team philosophy? How do you use the statistical data to positively affect your team?
Step one – take a deep breath.
All of these questions can be answered, but you need to start with the basics before you jump to roster construction and team philosophy.
Let us start off with a snippet of glorious advanced statistics history. One of the most popular stats in hockey is the aforementioned SAT%, which is a tabulation of shot attempts. The funny part is, while the data is calculated using shot attempts, its purpose is to highlight puck possession during a game as a determination of winning.
But that isn’t the glorious history part.
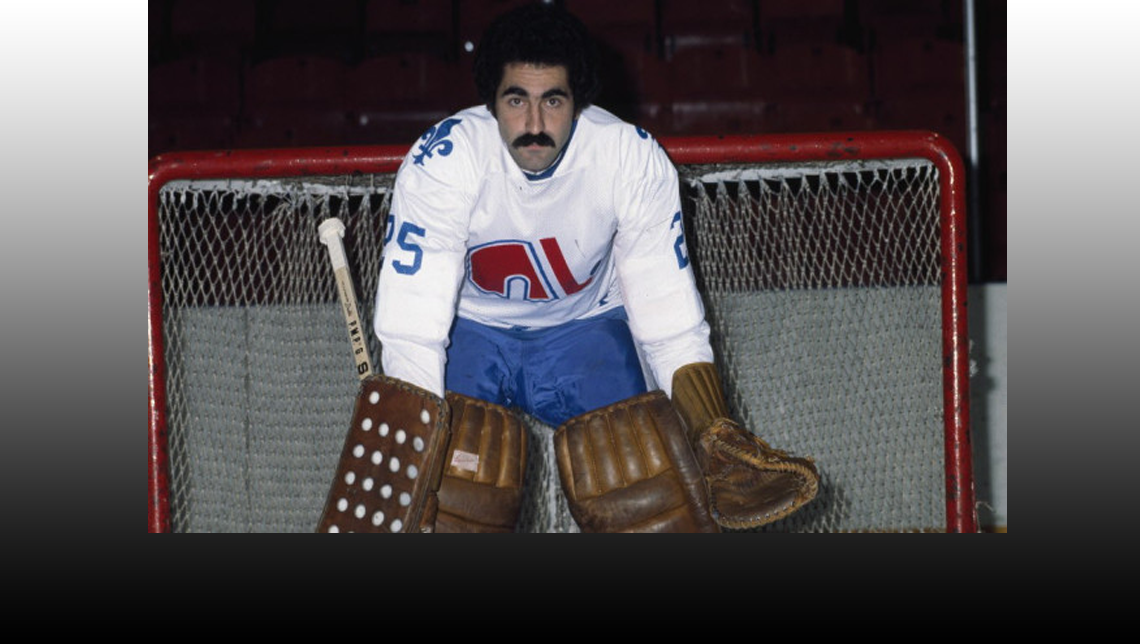
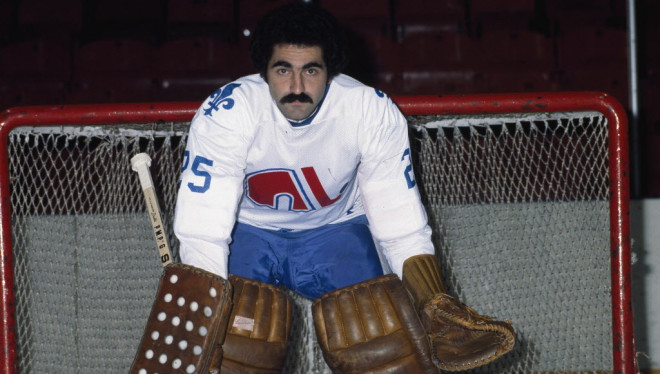
The glorious history is that this metric was originally created by Edmonton Oilers blogger Tim Barnes who wrote his content under the pseudonym Vic Ferrari and originally named the stat "Corsi" because he liked former goaltender coach Jim Corsi’s mustache (pictured above during his playing days).
To repeat: A fan blogger created a game changing statistic under a fake handle and named it after a dude’s mustache. And it stuck.
Now that is awesome.
Corsi breaks down something like this: Shot Attempts FOR (shot on goal, blocked shots, missed shots) minus Shot Attempts Against. If a team is shooting more than their opponent that means they are spending more time in the offensive zone and carrying possession. Relatively simple stuff, but onceit was found to directly correlates with winning, everyone started paying attention.
Since its original creation Corsi has been adjusted, tweaked, recalibrated and advanced. And that is the great part of advanced sports analytics, they are always being refined and, well, advancing.
But how do you learn this stuff? How do you learn not just Corsi, but Fenwick, SPSV%, G/60 and Zone Starts? Statistics courses in college are nice, but they don’t focus on sports and definitely not on hockey.
These are exactly the type of skills you will learn in our 8 week online Hockey Analytics course, which will give you the power to not only understand, but to implement, data driven decision making within a hockey organization like:
- Corsi, Fenwick, PDO, Zone Starts, and other statistical measures
- Sabermetrics in hockey
- Roles of Analytics in the NHL
- What a day in the life of an analyst is really like
- Standard and advanced hockey statistics
- Arbitration
- Data-driven Advanced Scouting and in-game preparation
- How to capture & analyze data and video content
- Various hockey analytics software options
- Statistical solutions used in the NHL
Our Hockey Analytics course is taught by leaders in the hockey industry like Peterborough Petes GM Mike Oke, former NHL defenseman and Statstrack developer Drake Berehowsky and a host of other influential minds in the game.
If you are looking for entry level positions within hockey leagues, associations or teams, with third-party vendors and consultants, or you are just a hockey fan who wants to better understand the tools the pros use to evaluate players, this course is for you.